
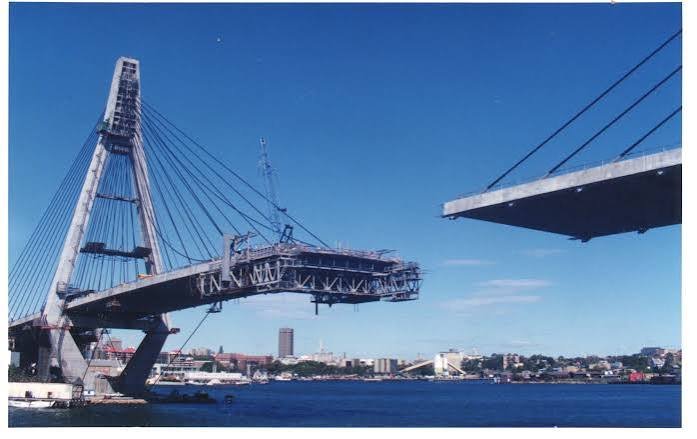
Engineering construction: execution of growth strategy
PROPERTY, INFRASTRUCTURE & CONSTRUCTION · GROWTH STRATEGY · MERGERS & ACQUISITIONS
The situation
A major construction business had already worked out that it could not grow at the rate its group required from the building sectors it knew. Engineering construction was 41 per cent of a $92 billion market and it had almost no presence in it. Four routes into the sector were tested and only one delivered a step change, which was a major acquisition, and the market analysis showed that very few businesses of the necessary scale were available to buy. A candidate was pursued and it did not proceed. The strategy went on the shelf.
Four years later the same question came back in a better form. By then engineering construction had risen to about half of all construction work done in Australia, having compounded at 19 per cent a year through the period against 13 per cent for non residential building and 6 per cent for residential. A large diversified contracting group then came into play when a planned float was pulled in weak equity markets, which put a business of genuine scale in front of a trade buyer. The question was no longer whether the sector was right. It was whether this particular business filled the specific gaps, and what it would take to put two organisations together without damaging either of them.
Before
A thesis proven and a first target lost
Almost no engineering construction capability
Few businesses of scale available to buy
An earlier acquisition still standalone after nine years
No integration plan for a deal this size
The work
The first tested whether the sector thesis held and how to act on it. The second assessed a live target and planned the integration. Five strands:
Sized and segmented the sector properly the first time, off construction work done, independent long range forecasts and project level investment data rather than off the general impression that infrastructure was busy. Engineering construction was 41 per cent of a $92 billion market, dominated by roads at 29 per cent and heavy industry at 20 per cent with electricity, telecommunications and rail behind them. The average project under construction or committed was $185 million and 36 per cent of identified projects were above $100 million. Private funding had risen from $7.2 billion to $17.6 billion in four years and had overtaken public funding. The national infrastructure report card rated the sector adequate at best, with roughly $24.8 billion of estimated underinvestment. This was a structural shift rather than a cycle to ride.
Tested four entry routes against a single set of criteria instead of arguing about them. Organic growth, joint venture, small acquisition and major acquisition, each scored on contribution to step change growth, timetable, whether targets were identifiable, competitive position, revenue diversification, execution risk and group synergy. Only a major acquisition delivered what the group needed, so the finding was that the sector was right, the route was acquisition, and the binding constraint was availability.
Screened the market so that constraint could actually be seen. Seven sub sectors were assessed on size, forecast growth, latent demand, competitive environment and synergy, leaving roads, rail, electricity transmission and distribution and parts of heavy industry as the ground worth holding. Every large player in the Australian market was then profiled on revenue, EBIT, margin, market capitalisation, contracts won and work in hand, which showed how few could provide competitive scale and how few of those were obtainable. That is the piece of work that let the strategy survive losing its first target, because it had already established that the ways in were few, which made waiting a position rather than a failure.
Four years on, assessed the live target on capability rather than on financial fit alone. Three years of project data was mapped by sub sector and average contract value for each of the two operating businesses and for the acquirer. One was deep in water and roads, with those two sub sectors accounting for the largest share of its work and more than twenty road projects in three years. The other carried higher value work in commercial and social building, ports and bridges and tunnels. Overlap and gaps were then plotted against market size and forecast growth, so the board could see what it was buying, what it was duplicating and what it still would not have.
Designed the integration before completion rather than after it. Thirteen executives were consulted, drawing on both internal and external experience, on risks, concerns and what had gone wrong in the acquirer’s own previous deals. Those lessons were specific and uncomfortable. One earlier acquisition had run as a standalone business for the better part of a decade with poor cultural integration. Another was progressing but behind schedule. What came out of it was a staged strategy of merge, then integrate, then transform, across nought to twelve months, twelve to twenty four months and beyond: acquired brands retained at first to stabilise operations, finance and risk roles placed from day one, the overlapping building businesses merged next, and the engineering capability repositioned by sector last. Milestones were fixed at day one, day thirty, and six, nine and twelve months, under seven defined integration themes.
Underneath all of it sat three years of financials for every entity, the full list of engineering construction projects in the country and their clients, competitor reporting, and a scan of more than a hundred market participants.
After
Sector entry decided on evidence, not availability
Capability gaps mapped project by project
Integration designed before completion
Merge, integrate and transform across two years
Day one to two year milestones with owners
The outcome
A sector thesis that held for four years and was executed rather than revised. The 2006 work said the sector was right, the route in was acquisition and the constraint was availability. By 2010 engineering construction had gone from 41 per cent of construction work done to about half, and had compounded at 19 per cent a year against 13 per cent for non residential building and 6 per cent for residential. Nothing in the original analysis needed to be walked back.
A target assessed on what it added rather than on what it cost. Capability mapping across three years of project data showed the acquisition filled sub sectors where the acquirer had limited or no capability, including deep credentials in roads, the second largest component of the engineering construction market, together with complementary building capability in segments it did not normally compete in.
An integration strategy written before completion and built on the acquirer’s own record rather than on general principles. Because a prior acquisition had been left to run standalone for years, this one staged brand retention first, then merger of the overlapping building businesses, then repositioning of the engineering capability, with governance, safety and risk in place from day one and synergy extraction deliberately held back to month twelve.